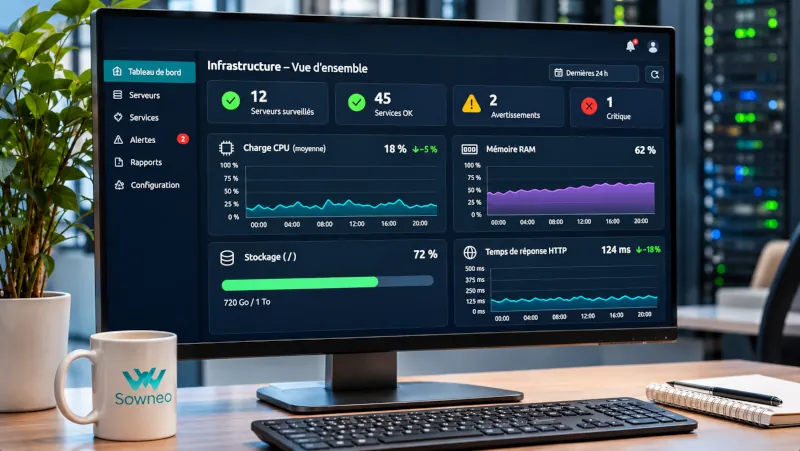
High CPU usage, disk space exhaustion, or abnormally slow application response times can be early warning signs of a server failure. Server monitoring helps identify these issues before they disrupt business applications and IT services.
Sowneo uses its own monitoring tool, Genesix, which provides non-intrusive monitoring through SSH-based probes, without requiring the installation of a monitoring agent or changes to firewall settings.
Looking to monitor your servers ?
Talk to Sowneo about your infrastructure monitoring needs.
Detect server issues before they cause service disruptions
A server can remain accessible even when an application service is not working properly. Therefore, IT infrastructure monitoring must cover both system resources and hosted applications.
Proactive monitoring collects metrics, analyzes changes over time, and identifies issues that need to be investigated. It complements IT infrastructure management, which handles day-to-day operations and incident response beyond simply detecting problems.
Analyze CPU, RAM, and Storage Metrics to Detect Performance Degradation
Server resource monitoring tracks several key metrics, including CPU usage, memory pressure, and storage performance. However, a single measurement isn't always enough to identify an IT incident.

Monitor server CPU load and memory pressure
High CPU usage can slow down request processing when the load stays consistently high. Similarly, memory pressure can increase the use of swap space.
Therefore, the analysis focuses on the duration of CPU usage spikes, available memory, and application response times. High RAM usage alone doesn't necessarily mean a server is running low on available memory.
Monitor storage latency and input/output errors
File system utilization alone doesn't provide a complete picture of storage health. Server monitoring also tracks read and write latency and input/output (I/O) errors.
For example, unusually slow disk access can delay database queries. I/O errors may also indicate a hardware issue or a problem within the storage infrastructure.
Check the availability of web servers, databases, and network services
A server that is reachable over the network doesn't necessarily mean its application services are running properly. That's why IT teams combine network checks with application availability tests.
Monitor HTTP responses and web server errors
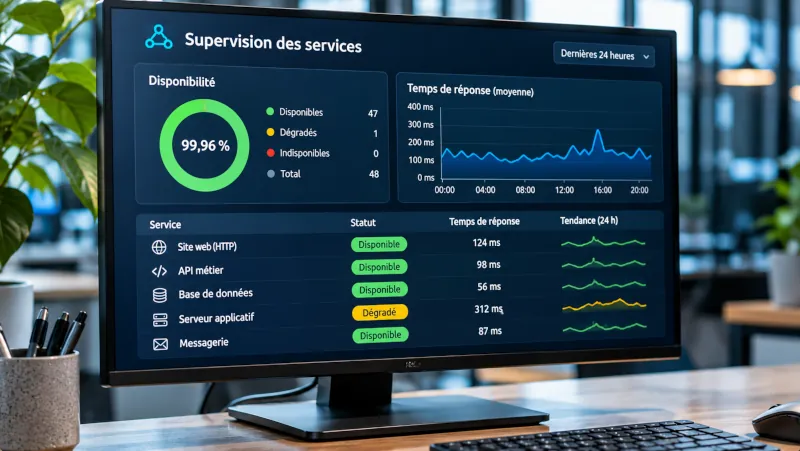
An open TCP port confirms that a connection can be established, but it doesn't mean a web application is working properly. An HTTP test, however, can measure web server response times and detect HTTP error codes.
For critical services, a functional test can also verify that an application performs an operation as expected by the user. Even an HTTP 200 status code doesn't guarantee that an application workflow is functioning correctly. To verify the entire PHP processing chain of a web service using PHP-FPM and FastCGI caching, the cache must first be invalidated and regenerated.
Monitor database connections and queries
A database can accept connections while responding slowly to application queries. The operating system's OOM killer can also terminate a database process if memory usage becomes too high. Therefore, database monitoring can track connection times, errors, and test queries.
These checks are particularly relevant to server-side applications used to host databases and web services.
Set alert thresholds for CPU, RAM, and disk space
Server alert thresholds help detect system resource saturation or application downtime. However, generic thresholds can trigger too many false alerts or fail to detect actual performance degradation.

CPU

RAM

Disk space
Adjust alert thresholds to match normal server workloads
IT teams assess CPU utilization based on the applications running on each server and their activity levels. Similarly, RAM alerts need to distinguish between normal memory usage and actual memory pressure.
For storage, remaining disk space and how quickly it is being used provide more useful information than the percentage of disk space used alone.
Trigger alerts for persistent issues
A brief spike in CPU usage doesn't necessarily require intervention. Therefore, a monitoring alert can be configured to trigger only when a threshold is exceeded for a specified period.
However, critical application downtime may require faster alerting. The rules depend on the business impact and the established operating procedures.
Prioritize alerts based on server and application criticality
Monitoring alert management must distinguish between technical issues and incidents that actually affect users. This helps teams prioritize alerts instead of treating every notification with the same level of urgency.
Assess the impact of alerts on production applications
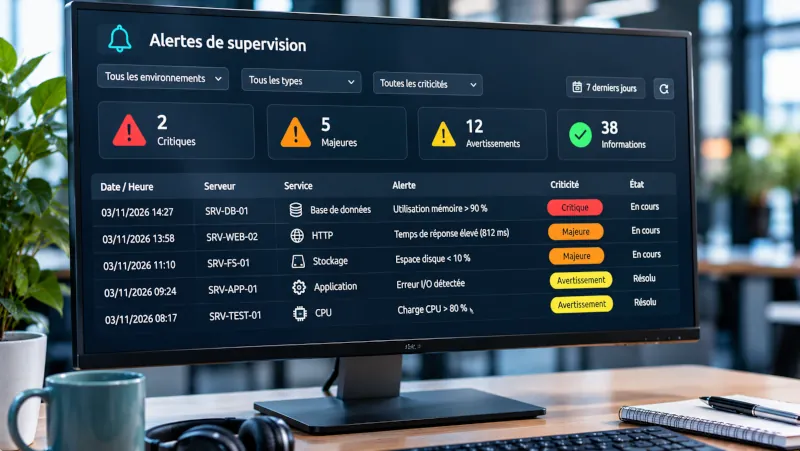
High CPU usage on a test server doesn't have the same impact as an unavailable production database. Therefore, IT teams assess each alert based on the criticality of the affected IT service.
Group related alerts to reduce monitoring noise
A network outage can trigger multiple service availability alerts across servers and applications at the same site. By grouping these notifications, IT teams can avoid treating a single incident as multiple unrelated failures.
Include diagnostic information in critical alerts
A server incident notification should identify the affected system, the impacted service, the relevant metric, and when the issue was detected. This gives the technical team the information it needs to begin diagnosing the IT incident.
However, sending an alert is not the same as resolving an incident. Receiving an alert doesn't necessarily mean that corrective action has started.
Detect disk space exhaustion before database writes fail
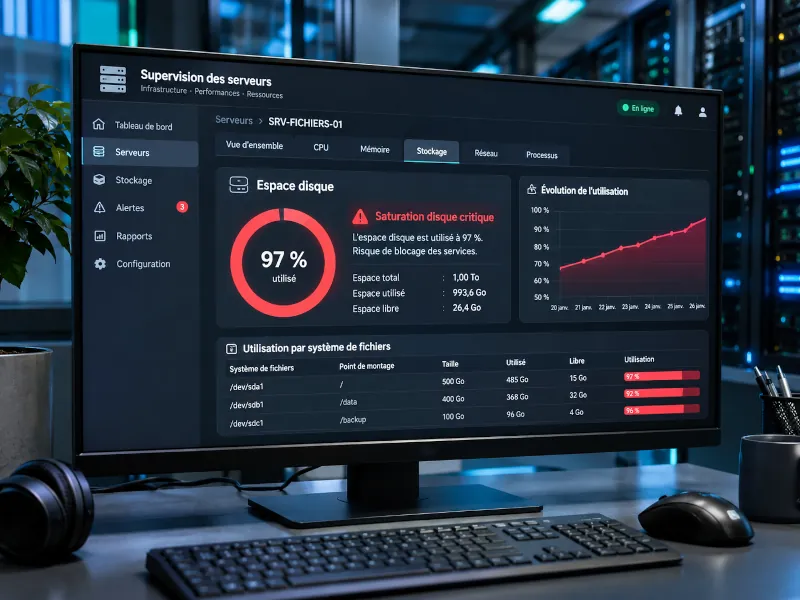
File system saturation can prevent a database from writing new data. For example, growing application logs or temporary files can use up the remaining disk space.
By monitoring available disk space, IT teams can spot this trend before database writes fail. They can then investigate the cause and plan to expand the storage volume if necessary.
However, a disk usage alert doesn't tell the team which files can be safely deleted. Before taking action, the team must check what those files are used for and how long they need to be retained.
Plan for server CPU, RAM, and storage capacity needs
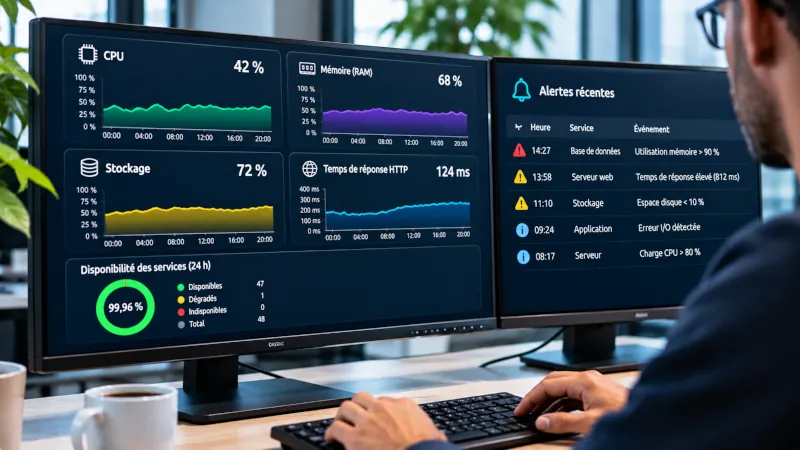
Historical server metrics help IT teams track changes in resource usage over several weeks. By analyzing trends in available memory, CPU load, and the amount of data stored, teams can better anticipate future resource needs.
This IT capacity planning helps teams prepare to scale up server resources before they reach capacity limits. However, forecasts must also account for spikes in application activity, changes in usage patterns, and new projects.
Combine server monitoring and IT infrastructure management to handle incidents
Server monitoring detects signs of potential issues but doesn't replace troubleshooting or system administration. IT infrastructure management can then help coordinate incident response, depending on the agreed scope of services.

Connect system alerts to server incident diagnosis
A memory saturation alert may indicate a normal increase in workload or unusual application behavior. Before taking corrective action, IT teams compare system metrics with application logs and recent events.
Define incident response responsibilities for Linux infrastructure
Sowneo helps businesses manage their Linux infrastructure and IT services. However, each project must clearly define the monitoring procedures, how alerts are communicated, and who is responsible for responding to incidents.
Do your production servers host critical applications or data ?
Contact Sowneo to discuss monitoring your IT infrastructure.